Website Speed Optimization for Maryland Businesses Your website looks fine on your laptop, but what does Google say?
Google measures your site on a mid-range phone on a 4G connection. That is the score that affects your rankings and your bounce rate. It is very common for a website to score far higher on desktop than on mobile; in some cases the gap is as wide as 90 on desktop and 40 on mobile. Closing that gap is exactly what a specialized speed optimization service does, and we ran the full process on our own site first. The results are documented further down this page.
 Free Speed SnapshotNo obligationBefore and after documented
Not sure where your site stands? Contact us with your site URL and we run a free Speed Snapshot for you: your mobile score, desktop score, LCP reading, and the single highest-impact issue, with no commitment to anything further.
Let's Start Your Project
What website speed optimization actually repairs
A strong desktop score does not mean your site is fast where it counts. Google does not measure your website on the newest phone with a fast connection. It measures it the way most people actually browse: on an average mid-range phone with a regular 4G connection. That is the standard test Google runs on every site, including ours. If your site was built and tested on a laptop, you have never seen what your customers see on their phones. Speed optimization closes that gap by finding the specific code and assets slowing the real-world experience, and fixing the highest-impact problems first.
A website speed optimization service starts with a diagnostic, not a guess. We use our own intelligent diagnostic tools to identify every problem Google is flagging on your site, name the three to five issues costing you the most, and either hand you the prioritized fix list or implement the fixes ourselves. Before and after scores, same tool, same conditions.
With the right strategy in place, businesses can:
Lower bounce rate on mobile: Visitors who wait more than three seconds leave. Faster pages hold them long enough to read your offer and take action.
Stronger search rankings: Core Web Vitals (LCP, FCP, CLS) are a confirmed Google ranking factor. A slow mobile score is a measurable handicap that faster competitors exploit.
More leads from existing traffic: You are already paying for those visitors through ads or SEO. Speed turns more of them into contacts without spending a dollar more on acquisition.
Higher AI search citation rate: AI tools like ChatGPT and Perplexity favor pages that load and render cleanly. A site that stalls on mobile is harder for agents to process and cite.
Proof you can share: We document the baseline before we touch anything and measure again after every fix is live. You get a dated, before-and-after result, not a verbal assurance.
Speed problems are not random. Every site has three to five bottlenecks that account for most of the slowdown. Third-party scripts loading when no user has triggered them. Images sized for a desktop monitor displayed at 46 pixels. Render-blocking stylesheets delaying first paint by two seconds. Finding those specific issues is the diagnostic step. Fixing them, in order of impact, is the implementation step. We do both, or either, depending on where you are.
Let´s Talk About Your Project
The Case File: qadigitalpartners.com, Before and After
We ran the full process on our own site before offering it to anyone. These are the actual PageSpeed Insights reports, captured before and after, same test, same conditions.
1
What Google showed
PageSpeed Insights flagged 54 on mobile. Our own diagnostic baseline read 59 on mobile and 82 on desktop.
2
What we found
A reCAPTCHA script loading 1MB of third-party code and consuming 20 seconds of CPU time on every page open, even when no visitor ever touched a form.
3
What we did
We lazy-loaded it to activate only on first form interaction. No visual change, no lost functionality.
4
What changed
The next day, the same PageSpeed Insights mobile test showed 73. Desktop went from 89 to 97. Accessibility reached 100 on both.
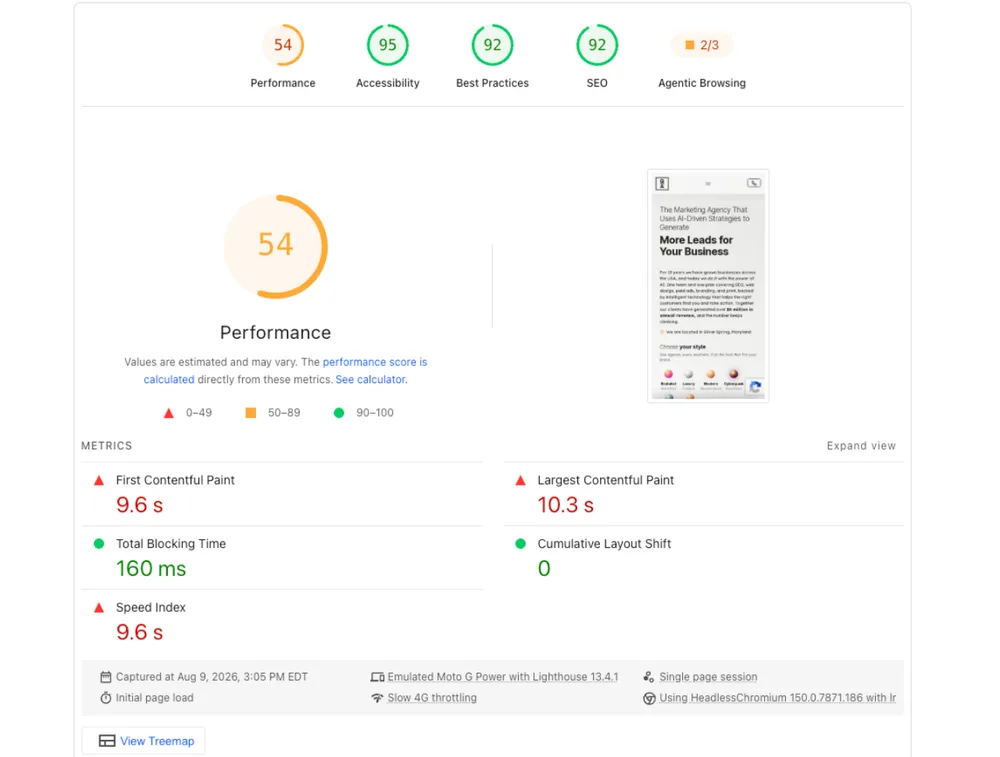
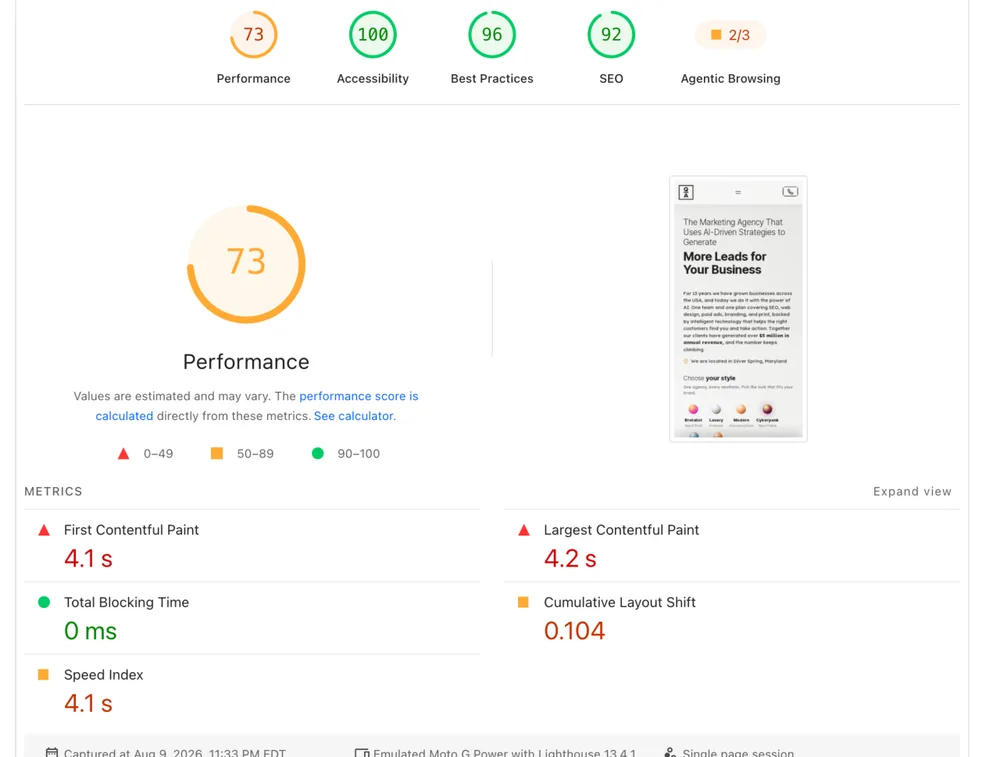
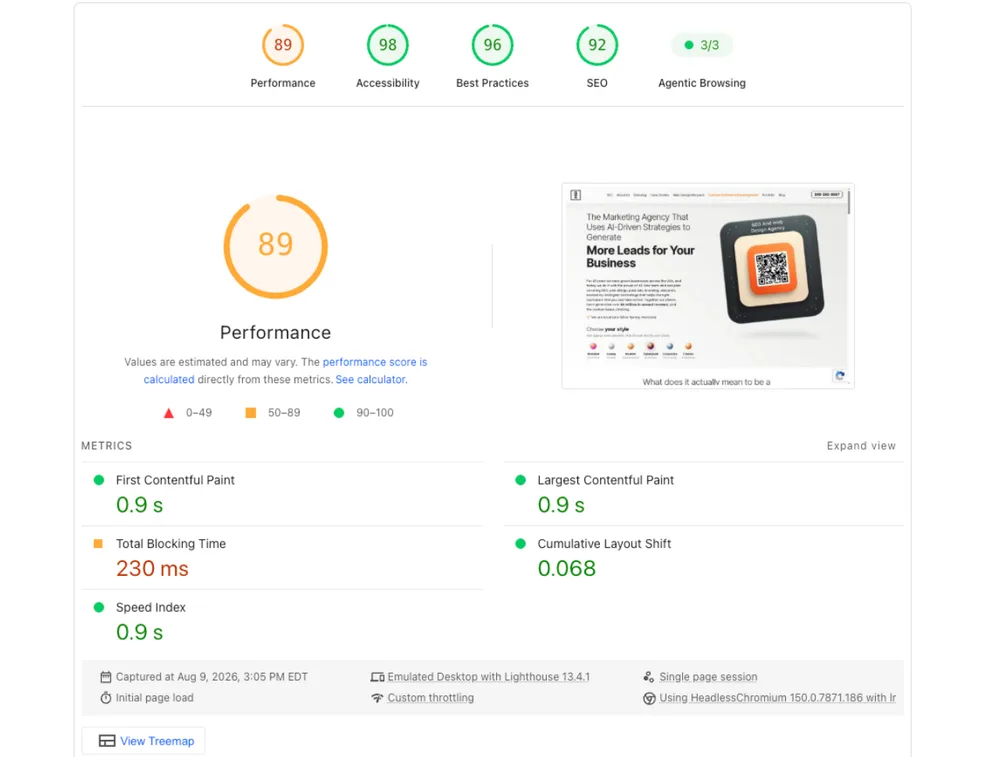
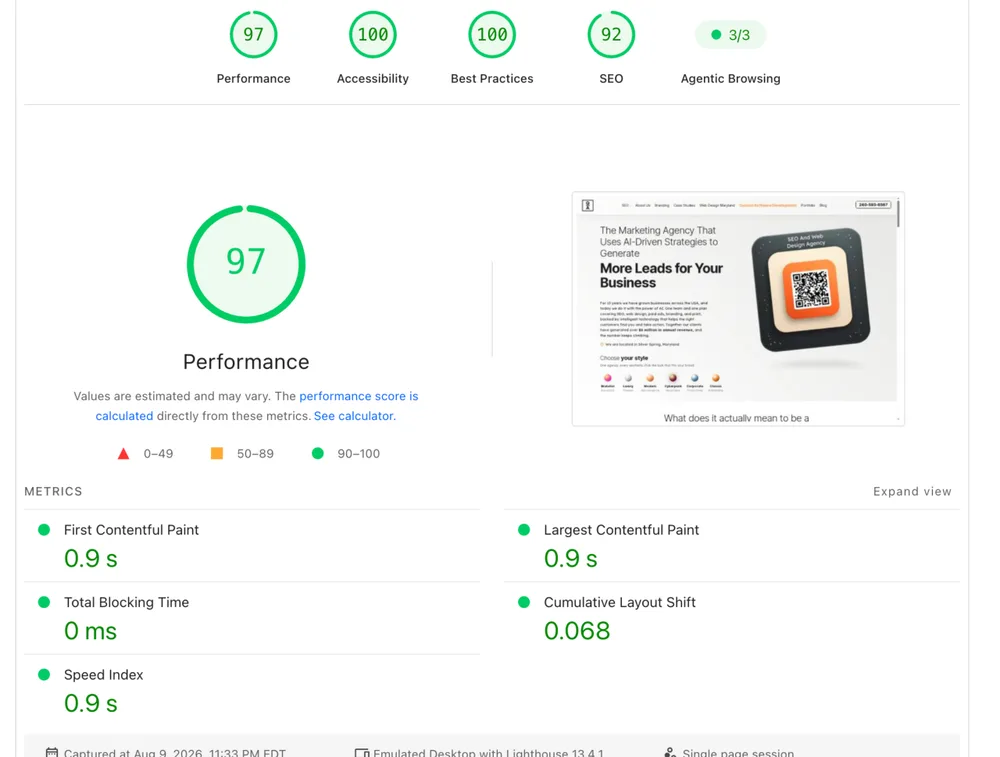
Scores from PageSpeed Insights and Lighthouse 13.4.1 on the qadigitalpartners.com live site, 2026-08-09. Same tool, same conditions, before and after. Results depend on site architecture, stack, and starting conditions. We do not promise specific score targets.
Mobile test conditions as documented by Google's own tools: emulated mid-range phone on a slow 4G connection, the line printed on every PageSpeed Insights mobile report, including the ones above.
Read the full walkthrough of what we found and fixed: Website Speed Optimization Case Study
Key Elements of Our Website Speed Optimization Service
Every element below comes from the same process we ran on our own site, documented above. Nothing here is theory: each one has a before-and-after number behind it.

HOW IT WORKS
Contact us with your site URL. We run a free Speed Snapshot on your live site and show you the results: your mobile score, desktop score, LCP reading, and the single biggest problem Google is measuring against you. No charge. No commitment. If those numbers show meaningful room to move, the Speed Audit is the next step: a full diagnostic with the three to five highest-impact issues named, the mechanism behind each one explained, and a prioritized fix list delivered in writing. If you decide to implement, the Speed Fix is paid implementation, and the full Audit cost applies as a credit. Each step is a complete deliverable. You can stop at any point.

OUR DIAGNOSTIC METHOD
We use our own intelligent diagnostic tools to surface every issue Google is flagging on your site, not just what a surface-level scan shows. A warning that reads “reduce JavaScript execution time” is a symptom. The mechanism might be a script loading 1MB of code and blocking the main thread for 20 seconds on every page load, even when the functionality it gates is never triggered. We find that. We name it. We explain what it means for your score and for your users.

MEASURED BEFORE AND AFTER
Every engagement begins with a documented baseline and ends with a documented result, using the same tool and the same conditions. PageSpeed Insights and Lighthouse are public and replicable. We document the version, the conditions, and the date. You can rerun the test yourself and verify the numbers. We do not switch tools between the before and after measurement to make the delta look larger.

WHAT WE DON'T PROMISE
We do not promise specific Lighthouse scores. Some sites move fifteen points. Others move five. What determines the range is your site's architecture, your current third-party script load, and your starting conditions. What we promise: an honest diagnostic, documented fixes with the reasoning behind each one, and a before-and-after measurement you can verify independently. You will know exactly what changed and why.
Why Choose Our Website Speed Optimization Service?
Generic speed advice says to compress images, enable caching, and use a CDN. That advice is not wrong. It is just incomplete. The problems that cost the most are usually hidden in third-party scripts and rendering behavior that surface-level tools miss. Here is what separates a real diagnostic from a checklist pass.
We measure before we touch anything
Every engagement starts with a documented baseline on your live site, mobile and desktop, before we change a single line of code. You cannot demonstrate improvement without a before score.
We name the mechanism, not just the symptom
"Slow LCP" is a symptom. "reCAPTCHA loading 1MB of JavaScript and blocking the main thread for 20 seconds on mobile even when no form is visible" is the mechanism. We find the mechanism.
We prioritize by impact, not by ease
A site with eight speed issues does not need eight fixes in the order they appear in the report. We rank by potential score gain and fix the highest-leverage problems first.
We use the same tool before and after
PageSpeed Insights and Lighthouse are public and replicable. We use the same version, the same conditions, before and after every engagement. You can rerun the test yourself and verify the numbers.
We work in your actual stack
Fixes depend on how your site is built. We implement changes in the real codebase, not a staging environment that measures differently from your live site.
We deliver everything in writing
The report includes what we found, what we changed, what each change was designed to do, and what the before and after scores were. Nothing is a verbal summary or a black box.
Not sure where your site stands? Contact us and we run a free Speed Snapshot for you.
We run our diagnostic tools on your live site and show you the results: your mobile score, desktop score, LCP reading, and the single highest-impact issue dragging your performance right now. No charge. No commitment to anything further. If what you see warrants a deeper look, the paid Speed Audit picks up from there: a full diagnostic, mechanisms named, fix list in writing.
The Process: How We Speed Up Your Site, Built on Proof
Five steps, every one of them measured. You see the same evidence we look at, dated and documented.
STEP 1: LIGHTHOUSE BASELINE
We run Lighthouse on your live site, mobile and desktop, before touching a single line of code. This is your before score. Every number we report after implementation is measured against this baseline, using the same tool and the same conditions. No before score means no provable result.
STEP 2: DIAGNOSTIC WITH MECHANISMS
We review the full audit output and identify the three to five issues with the highest potential score impact. For each one, we document the mechanism: what is actually happening in the browser, not just the warning label.
STEP 3: FIXES IN ORDER OF IMPACT
We implement the changes, starting with the highest-leverage problem. For each fix, we document what we changed and the technical reason it helps. Common fixes include lazy-loading third-party scripts to activate only on first user interaction, converting images to WebP with correct output dimensions and explicit width and height attributes, resolving render-blocking CSS, and adding preconnect hints to external resources your site uses on load.
STEP 4: LIGHTHOUSE AFTER, SAME SOURCE
Once fixes are deployed to the live site, we run Lighthouse again. Same version. Same conditions. Same device emulation profile. This is your after score. The delta between the before and after is your documented result. We do not use a different tool for the after measurement to make the numbers look better.
STEP 5: DATED EVIDENCE DELIVERED
You receive a written report with your before scores, your after scores, a description of every fix applied, the reasoning behind each one, and the date the measurements were taken. The evidence is yours to keep, share with stakeholders, and verify independently. The full case study on what we found and fixed on our own site is on our blog: Website Speed Optimization Case Study.
Ready to see your numbers?
Contact us with your site URL. We run a free Speed Snapshot for you: your current scores and your single biggest drag, at no cost, with no commitment to anything further. If what you see warrants a deeper look, the paid Speed Audit is the next step.
Fill out the form with your name, your site URL, and your email. We will reach out with initial findings. Phone is optional; we will contact you by email first.
FAQs About Website Speed Optimization
Q: How much can my Lighthouse score improve?
Q: What is the difference between PageSpeed Insights and Lighthouse?
Q: Do I need to give you access to my website code?
Q: Will the fixes change how my site looks or works?
Q: How does website speed connect to AI search and SEO?
Your site has three to five speed problems right now. Let us find them.

No Obligation

Zero Risk

Expert Insights
Contact us with your site URL and we run a free Speed Snapshot for you: your current scores and the single biggest drag, at no cost and with no commitment. You leave with documented numbers and a clear picture of where your site stands.