We thought our site was fast.
We had reasons to. In our most recent audit of qadigitalpartners.com through Google's PageSpeed Insights, the desktop score was 89 out of 100. Accessibility was 98. Best Practices was 96. SEO was 92. We had built the site carefully, with modern tooling, clean code, and real attention to performance.
But we also know how Google works. Google is constantly re-evaluating how it measures and scores websites. The technology that looks impressive today can be obsolete tomorrow, and the bar only moves in one direction. Years ago, a page that loaded in 20 seconds was considered fast. Today, anything past three seconds is losing visitors, and it is very likely that in a few years anything far from 100 will count against you. So we do not wait to be surprised. We re-audit our own site under Google's current standards, the same way we do it for clients.
That re-audit is where the mobile story showed up. The mobile score was 54. First Contentful Paint was 9.6 seconds. Largest Contentful Paint was 10.3 seconds. On a mid-range phone on a 4G connection, which is how Google evaluates every site for rankings, our carefully built site was making visitors wait nearly ten seconds to see anything meaningful on screen.
That gap, 89 on desktop versus 54 on mobile, is not unusual. Most sites are built, tested, and previewed on laptops with fast processors and gigabit connections. The mobile emulation that Google uses, a Moto G Power on throttled 4G, exposes problems that are invisible in that environment. The processor is slower. The network is slower. Scripts that run in milliseconds on a laptop take seconds on mobile. The result is a site that feels fast to the people who built it and slow to the customers it is trying to convert.
This is the full account of what we found, what we did about it, and what the numbers showed after. We are publishing it because the problems we found on our own site are the same categories of problems we find on client sites. If you want to know what a real website speed optimization process looks like, this is the one we ran on ourselves.
The Assumption
Every speed problem hides behind an assumption that the site is performing reasonably. That assumption is almost always formed on desktop.
It is an easy one to form. Our PageSpeed Insights desktop run showed 89. The Lighthouse audit from a local development environment was slightly lower at 82, which is normal because local Lighthouse scores vary based on your machine and network. Both scores pointed in the same direction: the site is solid, performance is not a crisis, there are probably a few things to clean up but nothing urgent.
This assumption was wrong. Not because the desktop score was fabricated or inflated, but because desktop score and mobile experience are measuring completely different things. On desktop, our site had a 1.9 second FCP and a 1.9 second LCP. Clean. On mobile, those same numbers were 9.6 seconds and 10.3 seconds in PageSpeed Insights.
The lesson is not that desktop scores are useless. They are a valid signal for desktop visitors. The lesson is that a desktop score does not predict the mobile experience, and the mobile experience is what determines rankings in Google search. Google has used mobile-first indexing since 2023. The score that matters for SEO is the one that most site builders are not checking.
That is exactly why the mobile run is a permanent part of our re-audit routine, for our own site and for every site we work on. Standards move. The audit has to move with them.
What Google Showed
The PageSpeed Insights mobile run uses a specific emulation profile: a Moto G Power device on a slow 4G connection. This is not the worst phone on the market. It is a representative mid-range device. Throttling the 4G connection simulates realistic conditions for a large portion of mobile users. The test is designed to show how the site actually performs for the median mobile visitor, not for someone with a flagship phone on fiber at home.
Our numbers in that environment:
Performance: 54 Accessibility: 95 Best Practices: 92 SEO: 92 FCP: 9.6 seconds LCP: 10.3 seconds
(These numbers are from PageSpeed Insights run on qadigitalpartners.com before any changes, using Alfonso's recorded PDFs as the baseline documentation. Scores in PSI vary by run due to network conditions; we treat these as the documented starting point, not a precise scientific measurement.)
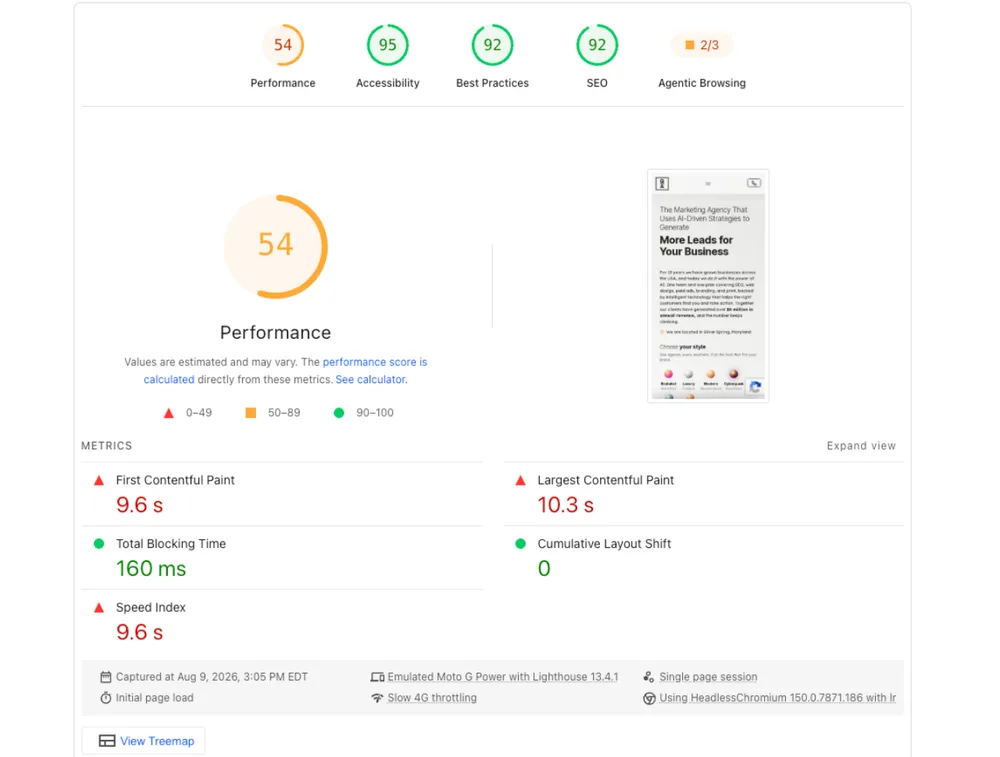
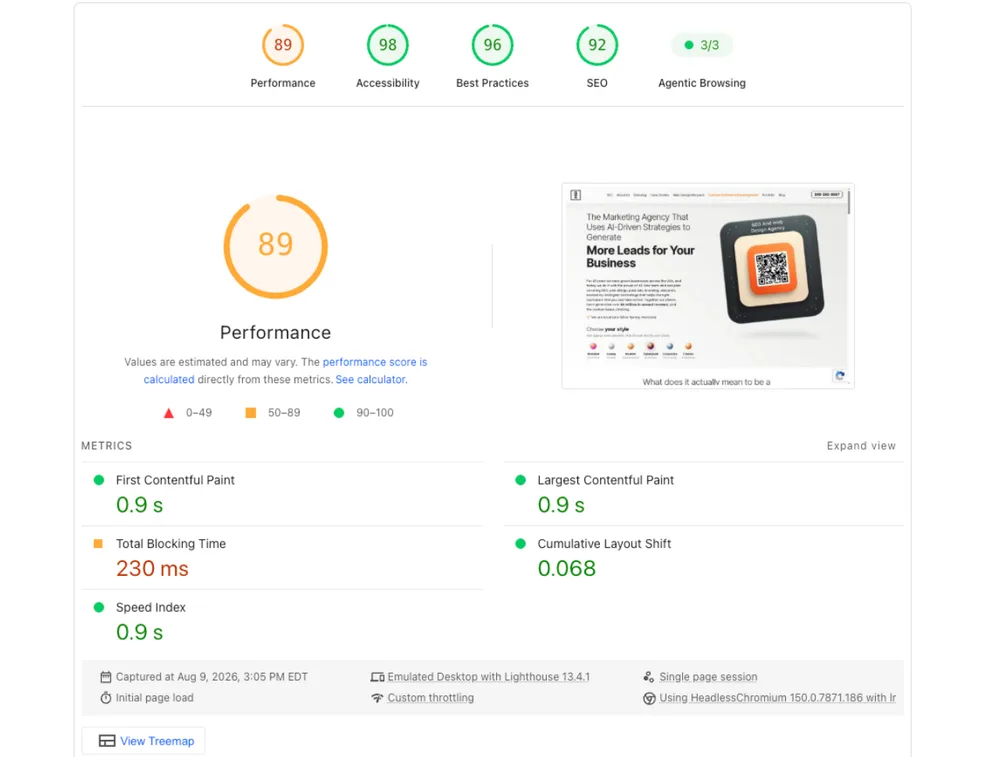
A 54 performance score on mobile means the site is in the bottom third of sites Google evaluates. An LCP of 10.3 seconds means visitors on a typical phone are waiting over ten seconds to see the main content of the page. In that window, most visitors have already left.
What made this more useful than a single bad score was the Lighthouse waterfall. The waterfall shows what loads, in what order, and how long each resource takes. We could see exactly where the time was going. The three biggest drains were not ambiguous once we looked at the data. They were specific, nameable, fixable problems. The next section covers what they were.
The Diagnosis
The waterfall told the story that the summary score only hinted at.
The first and largest problem was reCAPTCHA. Google's reCAPTCHA v3 script was loading on every page, at full weight, the moment the page opened. It transferred approximately 1MB of JavaScript and consumed roughly 20 seconds of CPU time on mobile emulation. The CPU time was what mattered most: while that script was running, the browser's main thread was blocked. Nothing else could render. The visitor saw a blank or partially loaded page while the phone worked through the script.
The reason this was so costly was that reCAPTCHA loaded unconditionally, even on pages where no form was visible. A visitor landing on the homepage to read about our services triggered a 20-second CPU job in the background, for a form they had not touched and might never touch. When we traced the form submission flow, we found that the reCAPTCHA token was not even being sent to our backend. The script was loading, running, and generating a token that went nowhere. 1MB of script and 20 seconds of CPU time for zero functional benefit on most page loads.
The second problem was images. We had eight JPEG thumbnails in the client showcase section of the homepage. Each thumbnail was displayed at 46 by 56 pixels in the actual layout. The files were each around 40KB, sized for a context much larger than where they were being rendered. In total, those eight images transferred roughly 320KB to show content that, at display size, contained almost no visual detail the extra bytes were providing. The browser downloaded the full-resolution files, decoded them, and scaled them down to thumbnail size in the viewport.
The third problem was CSS. The main stylesheet was 47KB and was render-blocking. On a slow 4G connection, the browser had to download and parse the entire stylesheet before it could begin painting the page. Lighthouse measured this delay at approximately 2.1 seconds on the mobile emulation. LCP, which is the time to the largest visible content element on screen, was pushed out by this delay because the text content that constituted LCP could not render until the CSS finished loading.
There were smaller issues as well. Seven links in the site used "Learn More" as visible text without descriptive aria-labels, which affected the SEO audit score. Several images were missing explicit width and height attributes, which is a Cumulative Layout Shift risk when images load at different times and push content around. A preconnect hint was missing for an external analytics service the site calls on load. The main layout was missing a proper landmark element, which affected the accessibility audit score and the agentic crawlability score.
The reCAPTCHA, the images, and the CSS were responsible for most of the mobile performance gap. The smaller issues affected accessibility and SEO scores but had a lighter impact on raw speed.
What We Fixed and Why
We applied fixes in two batches on the same day as the diagnostic.
The first batch addressed the image problem and several accessibility and SEO issues. We converted all eight client thumbnails to WebP format at 120px output width, which is the correct size for how they render in the showcase layout. The WebP files came in at 2 to 5KB each, compared to approximately 40KB for the original JPEGs. We also converted the full-size versions of those images to WebP, bringing the total image payload for that section from roughly 330KB down to under 220KB including both sizes. We added explicit width and height attributes to all eight thumbnails, which eliminates the layout shift risk during load.
We also added width and height attributes to other images on the page that were missing them: the header logo, the star rating SVGs, review avatars, the decorative dots, and the mosaic photo section. We added descriptive aria-labels to the seven "Learn More" links, correcting the SEO audit flag without changing the visible text. We added a landmark element to the main layout, correcting the accessibility audit. We added a preconnect hint for the analytics service. We set the fetchpriority attribute to high on the QR banner image in the header, which is the LCP element on desktop, to prompt the browser to load it earlier in the waterfall.
The second batch addressed reCAPTCHA. We modified all four forms on the site to load the reCAPTCHA script lazily, triggered only on the first interaction with each specific form field. Before this change, the script loaded at page open regardless of whether a visitor ever scrolled to or touched a form. After the change, a visitor landing on the homepage to read content triggers zero reCAPTCHA requests. The script loads only when someone actually starts interacting with a form. We verified this by opening the site in a fresh browser session and confirming that no reCAPTCHA requests appeared in the network tab until a form field received focus.
As a side finding from the reCAPTCHA work, we also noted that the token the script was generating was never being sent to our backend for validation. The script was running its full routine and generating a token that the form submission did not use. This is a decision to resolve separately, either by validating the token server-side or by removing reCAPTCHA from forms that do not need it. We have documented it for that future work. What mattered for speed was the lazy loading: zero script on page open means zero CPU cost on page open.
Every change we made had a specific, articulable reason. Lazy reCAPTCHA eliminates the 20-second CPU block on most page loads. WebP thumbnails at correct output dimensions reduce image payload by more than 90 percent for those eight files. Width and height attributes prevent layout shift. Preconnect reduces DNS and connection latency for external resources. fetchpriority=high tells the browser what to load first without waiting for its own heuristics.
The logic behind the order was impact. The reCAPTCHA was the largest single contributor to Time to Blocking and total CPU time on mobile. We fixed it second only because the image batch was faster to implement and we wanted to deploy a verified first batch before moving to the script changes. If we had to do one thing, it would have been reCAPTCHA.
The Numbers
We ran Lighthouse on the live site after both batches were deployed. The tool, the version, and the conditions were the same as the local baseline we had established before starting.
Before and after results (Lighthouse 13.4.1, qadigitalpartners.com, 2026-08-09):
Mobile: Performance: 59 before, 68 after (+9) Accessibility: 95 before, 100 after (+5) Best Practices: 73 before, 96 after (+23) SEO: 92 before, 92 after (unchanged) FCP: 5.6s before, 4.8s after LCP: 5.6s before, 5.2s after
Desktop: Performance: 82 before, 91 after (+9) Accessibility: 98 before, 100 after (+2) Best Practices: 100 before, 100 after (unchanged) SEO: 92 before, 92 after (unchanged) FCP: 1.9s before, 1.4s after LCP: 1.9s before, 1.4s after
Disclaimer: All scores are from Lighthouse 13.4.1 run against the qadigitalpartners.com live site on 2026-08-09. We used the same tool, the same version, and the same conditions for the before and after measurements. The "before" scores reflect the local Lighthouse baseline; the PageSpeed Insights mobile baseline (PSI, Moto G emulation) showed a 54, which is a different testing environment from Lighthouse local and not directly comparable to the Lighthouse after scores. Results depend on site architecture, stack, and starting conditions. We do not use these results to promise specific score improvements on other sites.
PageSpeed Insights itself closed the loop. The same tool that showed the 54 that started this whole process was run again after both batches were deployed, in the same mobile emulation. It showed 73 on mobile, with FCP at 4.1 seconds and LCP at 4.2 seconds, down from 10.3. Desktop moved from 89 to 97 with zero blocking time. Same source, same conditions, one day apart.
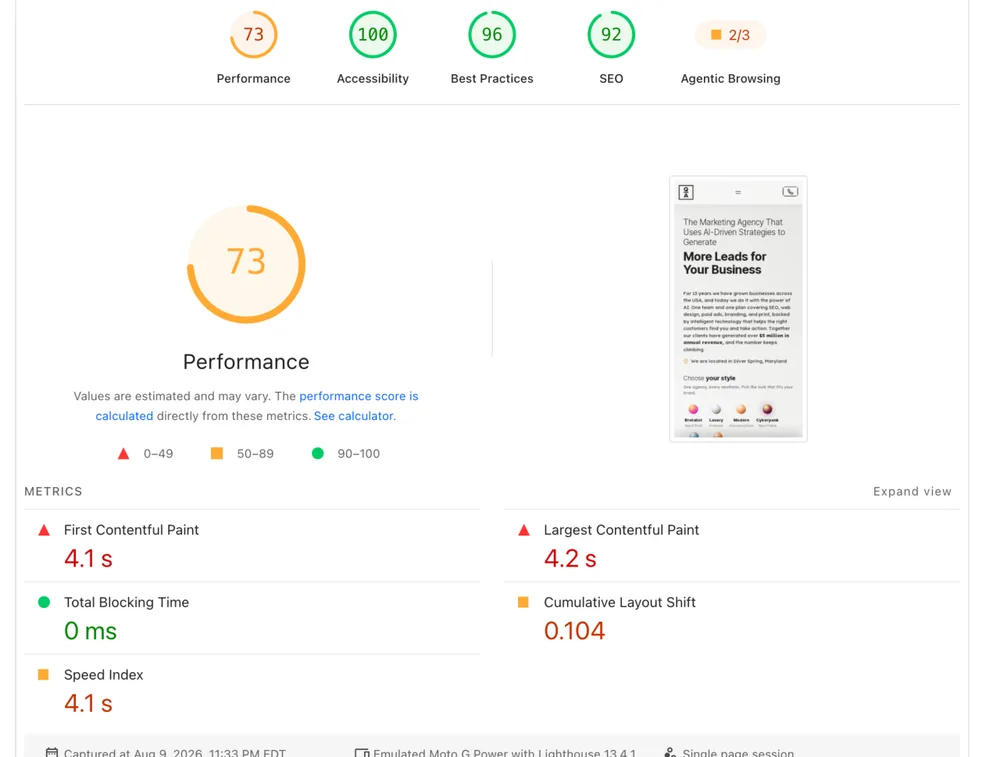
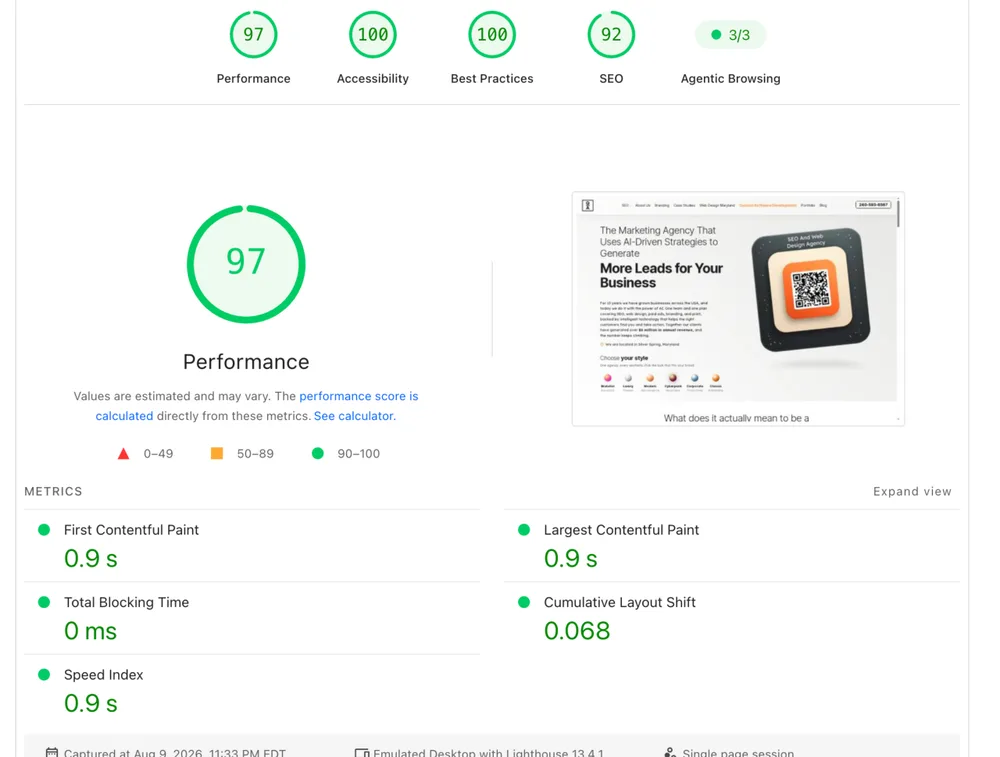
The SEO score remained at 92 after the aria-label additions. That is because Lighthouse's SEO audit evaluates link text by the visible text content, not the aria-label. The seven "Learn More" links still show "Learn More" as visible text. Changing them to distinct visible labels is a design decision that requires Alfonso's direction on the copy. The aria-labels fix the accessibility audit, which moved to 100, but not the SEO link text audit.
The Best Practices jump on mobile from 73 to 96 reflects issues that were resolved by the image and script changes, including deprecated API usage flagged by Lighthouse for certain third-party scripts that no longer appear in the same form after the lazy-loading implementation.
Every site has three to five speed problems that account for most of the gap between its desktop score and its mobile score. The work is finding them and naming the mechanism, not just accepting the Lighthouse warning text at face value. On our own site, the mechanism was a token that loaded megabytes of script and blocked the main thread on every page load without ever serving its purpose. That is what a real diagnostic surfaces.
If you want to know what that process looks like applied to your site, the service page at www.qadigitalpartners.com/website-speed-optimization explains how it works step by step. Contact us with your site URL and we run a free Speed Snapshot for you: your current scores and your single biggest drag, at no cost.
Frequently Asked Questions
Can I run PageSpeed Insights myself to see my score?
Yes. Go to pagespeed.web.dev, enter your URL, and run the mobile test. The score you see is your starting point. What the score does not tell you is which specific problems to fix first. The Lighthouse report behind the score has the detail, but reading the waterfall and mapping causes to effects is where the diagnostic work lives. That is what the Speed Audit at https://www.qadigitalpartners.com/website-speed-optimization does.
My site loads fast for me. Does that mean the score is wrong?
No. You are likely testing from a laptop on a fast connection, which is not what PageSpeed Insights measures. PSI emulates a mid-range phone on 4G. If your site was built and tested on desktop, you may have never loaded it under those conditions. The gap between desktop experience and mobile emulation is where most speed problems hide.
Is reCAPTCHA always a speed problem?
It can be, depending on how it is implemented. reCAPTCHA v3 loads a full JavaScript bundle when it initializes. If it loads at page open, that bundle runs before the page finishes rendering. If it loads lazily, triggered by the first form interaction, most visitors never pay that cost. The problem on our site was the unconditional load, not reCAPTCHA itself. The fix was a loading strategy change, not removing the tool.
Do image formats like WebP actually make a measurable difference?
Yes, when the images are also sized correctly for how they render on screen. On our site, the thumbnails were JPEG files sized for large displays but rendered at 46 by 56 pixels. Converting to WebP without correcting the output dimensions would have helped slightly. Converting to WebP at the correct output dimensions reduced the payload by more than 90 percent for those eight files. The format and the output dimensions both matter.